
In a nutshell
Amazon now lets shoppers in Germany see a product’s price history, just as Q4’s deal events begin to overlap. Together with the EU’s 30-day rule and Amazon’s own event requirements, that puts every advertised discount to a test. Will peak season survive that much transparency or could this even be an advantage to some sellers?
⏱ Time to Read: appr. 9 min
Amazon price history arrives In Europe Just Ahead of Peak Season
Amazon introduced price history in 2024. By its own count, more than 50 million customers worldwide have checked it, and in 2026 the chart was extended to 30, 90 and 365 days. Amazon names the US, UK, Canada and India as markets where the feature is available.
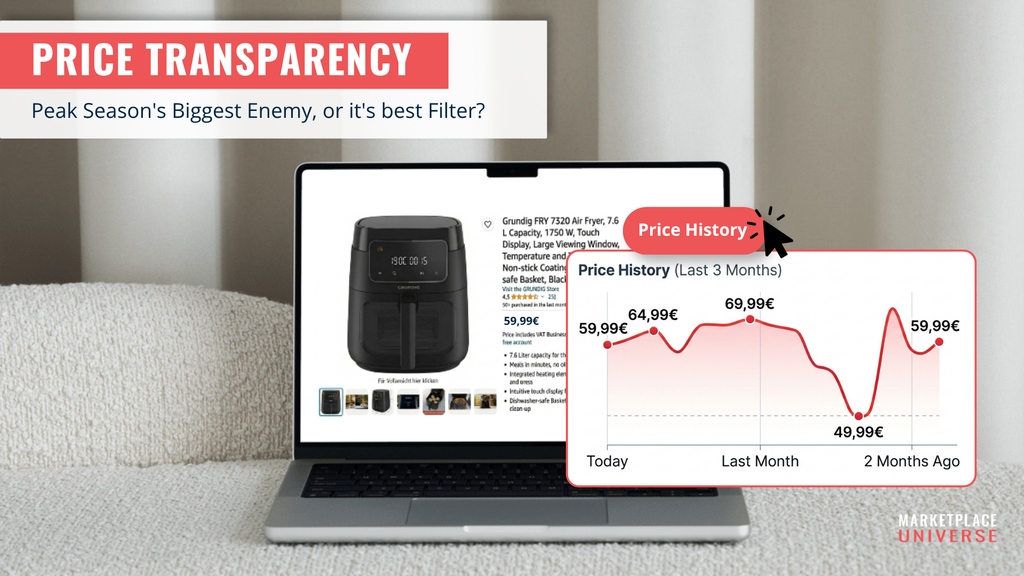
Germany has now joined, at least in part, as the first EU market in our checks. On 20 August, the German e-commerce trade outlet Onlinehändler News reported that a “Preisverlauf” (price history) link had started to appear next to the price on some product pages. It opens a chart inside Rufus, Amazon’s AI shopping assistant, with a choice of one month, three months or one year. A footnote in the panel states that the chart shows the lowest suggested offer per day (per week in the one-year view), shipping costs excluded. The rollout was uneven: not every product and not every channel showed the link, and some analysts speculated that Amazon was running an A/B test.
The timing matters. Amazon’s Prime Deal Days ran on 6 and 7 October, Black Friday follows on 27 November and Cyber Monday on 30 November. Shoppers who previously needed external trackers to put promised savings to the test can now do it inside the shop.
Amazon’s own seller rules already tie deals to real prices
Amazon’s German Seller Central documentation sets the frame. A manufacturer’s recommended price (UVP) must match a price that the seller or other retailers actually applied, and Amazon may hide a UVP it cannot verify.
Amazon has also tightened its own internal checks this year. Since April, validation of the List Price and UVP has been stricter; since May, Amazon has changed how it calculates the Typical Price (“Was Price”) — now based on a 90-day look-back. Sellers who discount constantly risk shifting their own reference-price baseline downward, and if Amazon cannot establish a valid reference price at all, the strikethrough price can disappear from the listing entirely.
For event deals such as Prime Day, Amazon separately sets a price ceiling: the highest price at which an item still qualifies. It is derived from the product’s reference price, the lowest selling price across all sellers in the previous 30 days and the lowest new-condition offer. The first two carry a required minimum discount, and peak events may demand a higher one.
Two different 30-day clocks are running at once
It’s worth keeping these two mechanisms apart, because they easily get confused. One is Amazon’s own internal reference-price logic described above — a 90-day check Amazon runs on itself to decide whether a strikethrough price is even allowed to show. The other is a separate, legally mandated rule that applies to any advertised price reduction, regardless of platform: the lowest price charged in the preceding 30 days. Amazon’s own system doesn’t replace this legal requirement — it sits on top of it. As Michael Frontzek, Marketplace Strategist at mi-commerce, puts it: “Amazon checks its reference prices under its own rules” — on top of, not instead of, the legal 30-day baseline sellers already have to respect.
The EU’s 30-day rule is universal, but its execution can differ
The Omnibus Directive (EU) 2019/2161 added Article 6a to the Price Indication Directive: an advertised price reduction must refer to the lowest price applied during a period of at least 30 days before it. Member states may set exceptions, for instance for perishable goods, so national details differ.
What shoppers see differs by store. In a quick check on 13 October, Amazon.fr, Amazon.it and Amazon.es displayed a lowest price of the last 30 days on several products, and Amazon.es also showed a median price. Amazon.nl showed a median price or a recommended retail price, and only Amazon.de offered the price chart. These are spot checks, and labels can vary by product and over time.
The Q4 calendar turns every discount into the reference point for the next one
Peak season used to be judged event by event. The 2026 calendar makes that harder: Prime Deal Days (6–7 October), an early Black Friday push in early November, Singles’ Day (11 November), Black Friday (27 November) and Cyber Monday (30 November). Several of them fall less than 30 days apart.
Michael Frontzek, Marketplace Strategist at mi-commerce, sees the pressure building there. “The biggest challenge for sellers isn’t Black Friday itself, it’s the discount spiral before it,” he says. “Prime Deal Days, Singles’ Day, Black Week and Cyber Monday: anyone who joins every event will eventually have to ask whether they still generate additional revenue or just give away margin.”
In Frontzek’s example, a product with a regular price of €99.99 costs €79.99 during the Prime Deal Days. The seller wants an attractive discount again a few weeks later — at Singles’ Day, Black Friday and Cyber Monday. Under EU rule, the lowest price of the previous 30 days is the reference for any advertised reduction. Once €79.99 has been charged, any promotion within the following 30 days has to be measured against €79.99, not €99.99. The trade association Händlerbund describes the same squeeze for sellers whose promotions follow each other within 30 days, as around Black Friday and Christmas: the reduced price becomes the comparison price. The result is pressure to offer an ever lower price at each event.
Prime Deal Days and Black Friday are 51 days apart, outside the 30-day window — so the legal rule resets. But the price chart doesn’t forget. If a product already cost €79.99 during Prime Deal Days and is offered again at €79.99 on Black Friday, a shopper who opens the three-month view sees it immediately: this deal isn’t as exclusive as the strikethrough price suggests.
👉 “The discount percentage tells shoppers how much they supposedly save. The price history shows whether the offer is actually special.”
Michael Frontzek, Marketplace Strategist, mi-commerce
Galaxus has done it before
Galaxus, the Swiss-German online retailer, has made price history public since 2021, in Switzerland and in Germany. At the launch it described itself as the first online retailer in Germany to show the historical price development of all products. Galaxus executive Oliver Herren said that getting a picture of price trends had previously been tedious for consumers, which is why Galaxus decided to open its data to them.
First, the retailer stated that more than 99% of its own prices, marketplace excluded, are set automatically, often several times a day, and that it has no influence on the prices of marketplace sellers. Second, in a 2024 Black Friday analysis, Galaxus said its category team does not adjust prices to make Black Friday Week discounts look better. Finally, a survey by GfK commissioned by Galaxus found that if a product had never been cheaper, four in ten Swiss respondents would buy immediately, while almost half would keep waiting.
Price history complicates planning for sellers
For sellers, the practical consequence is to stop treating events in isolation. Four habits now worth adopting:
- Plan Q4 as one price sequence. Each event can set a reference point for the next, and both the 30-day window and the three-month chart look backwards.
- Decide which events to join. Taking part in every event raises the question Frontzek put at the start: additional revenue, or margin given away.
- Check your own chart the way a customer does. The three-month view shows whether today’s deal price was already charged earlier this season.
- Keep reference prices verifiable. Amazon requires a UVP to match prices actually applied and may hide one it cannot verify.
Frontzek expects Black Friday to keep its weight. “I don’t think Black Friday will lose importance,” he says. “But sellers have to plan their pricing strategy far more long-term and can no longer treat each event in isolation.” In his view, Amazon is making discounts “not only more transparent for customers but also more complicated for sellers”: a high strikethrough price alone does not make a good offer, and the chart lets customers see more easily whether a supposed bargain is one.
Enemy or filter: verdict still pending
Price transparency is turning into a standard feature. Galaxus has offered it since 2021, Amazon has now followed. Whether other marketplaces will do the same is still unclear. But if you sell on either of those two or want to plan ahead, it might be advisable to already adapt to the possibility of transparent pricing on your products.
Key Learnings
- The 30-day rule and the price chart look at different horizons: events 51 days apart escape the rule, but not the three-month view.
- The same EU rule produces different shop windows. In our spot check, Amazon’s French, Italian and Spanish stores show a 30-day low, the Dutch store a median price or RRP, and only the German store offered the price chart.
- Amazon’s German event rules tie price ceilings to the 30-day low across all sellers plus a minimum discount.
- The chart shows the lowest suggested offer per day (per week in the one-year view), shipping excluded, for the product rather than for a single seller.
- Price trackers suggest Black Friday is often not the cheapest day, so a chart mostly makes visible what trackers already show.
- For sellers, Q4 is one price sequence, and each event is chosen by margin.
22.10.2026 – Written by Ricarda Eichler, Journalist and Author for OHN