In a nutshell
Marketplace-native data shows what happens on a platform – not what actually drives a business. Relying exclusively on individual marketplace dashboards means optimising platform efficiency, not profitability. Across multiple channels, the problem deepens, because the data speaks different languages. Independent multichannel analytics creates the layer from which sellers can finally ask the right questions.
⏱ Time to read: appr. 6 minutes
The Silo Problem: Data That Doesn’t Lie – But Doesn’t Tell the Whole Truth Either
Platform-native data is not wrong – it is precise, but only within its own ecosystem. Amazon measures what happens on Amazon, Zalando measures what happens on Zalando, eBay measures what happens on eBay. The problem lies not in the quality of this data, but in its scope. Every marketplace captures a slice of business reality – namely its own slice. Anyone who mistakes that slice for the full picture is making decisions on a systematically incomplete foundation.
In practice, sellers optimise what their dashboard measures well: traffic, conversion rate, ROAS, Buy Box share. What native dashboards are far less equipped to answer is the question that actually matters: whether a SKU makes any money once all costs are accounted for, whether a campaign is generating genuine new demand or simply capturing purchases that would have happened organically anyway, and whether a channel is growing the business or just pulling volume from somewhere else.
👉 Marketplace Universe Insight: Platform data shows what happened inside the channel – but not whether it was worth it from a business perspective.
As a multichannel platform for sellers and an integration specialist, our partner base encounters exactly this pattern every day. That is why we put together this joint overview of the most common blind spots and their consequences.
When KPIs Mislead
The KPIs that marketplaces prioritise make sense from a platform perspective – ROAS, conversion rate and Buy Box share all show what is happening inside the ecosystem. The problem lies in what they do not show.
- ROAS and margin are two different things. A campaign can post a strong ROAS and still contribute almost no profit once fees, shipping, returns and product margin are factored in.
- Conversion rate and profitability follow different logic. A price reduction typically improves the conversion rate. It can simultaneously damage margin and long-term brand positioning – the dashboard only shows the improvement, not the damage.
- And Buy Box share can grow at the expense of profitability. Aggressive price cuts win visibility and may lose money on every transaction.
The result is a systematic misunderstanding: sellers begin to equate marketplace efficiency with business success.
👉 Marketplace Universe Insight: A campaign can perform perfectly within a platform and simultaneously direct budget towards the wrong products, channels or customer segments – without any of this showing up in a native dashboard.
When Multiple Channels Enter the Picture, Things Get Structurally Complex
For single-channel sellers, the limitations of native analytics are still manageable. But as soon as a second or third channel is added, the situation changes fundamentally. The data suddenly speaks different languages.
Every platform defines performance in its own way, with its own reporting structures, fee models and attribution rules. What counts as a “sale” on Amazon is recorded differently on Zalando. And a direct online shop maps an entirely different conversion path. The result is data that is individually correct but not mutually comparable – and conclusions that make sense within one platform’s logic but systematically mislead when applied across channels.
👉 Marketplace Universe Insight: Selling on three channels means having three different definitions of success – unless you build a shared one yourself.
The Aha Moment: What the Data Actually Showed
A concrete example from practice, representing a pattern that repeats itself regularly:
A seller directed campaign budget towards the channel that performed best by units sold. Revenue grew , but contribution margin did not keep pace. The aha moment came when return rates were compared across channels for the first time: the supposedly best-performing channel had significantly higher return rates than all the others – a cost factor that had not been visible in any single platform dashboard.
As a result of this insight the seller shifted his budget towards a channel that had grown less strongly at the top line, but delivered considerably better profits once full cost accounting was applied. The best-performing channel in the dashboard is not necessarily the most profitable one in the business.
What Independent Multichannel Analytics Actually Changes
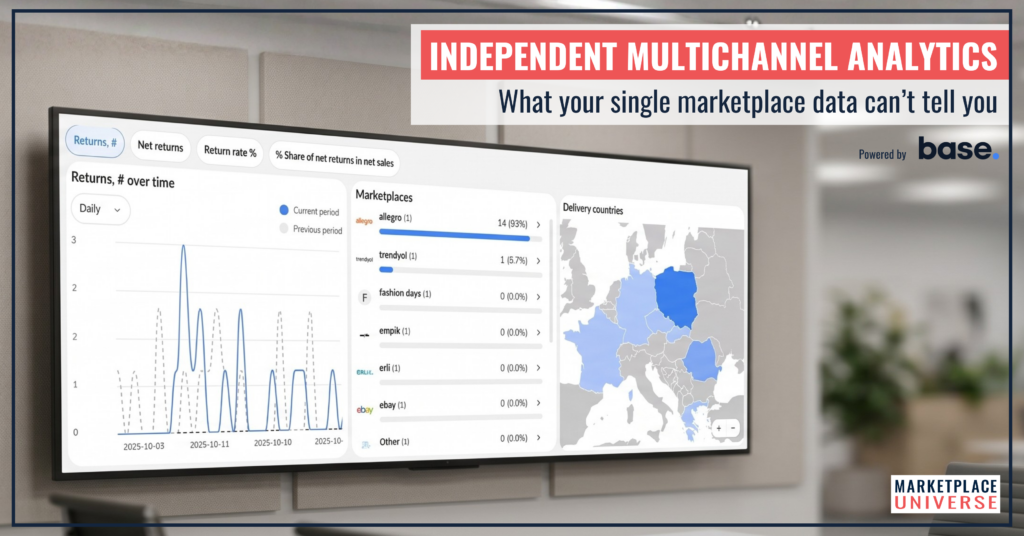
Independent multichannel analytics means analysing the business from a level above any individual channel. Instead of letting each marketplace define what performance means, a shared view emerges across channels, products, orders, inventory and pricing. Good multichannel-capable tools – such as the analytics product from base – bring these data sources together natively, without requiring a complex BI infrastructure to be built first.
Concretely, sellers can identify:
- Which channel is actually profitable – not just the one with the highest volume
- Which products generate revenue and which generate real profit – a distinction that platform-native reporting often blurs
- Whether a channel is creating genuine growth – or simply redirecting demand from another channel
- Whether operational issues such as fulfilment friction or inventory shortages are undermining commercial performance
Decision-making shifts from channel optimisation to business optimisation: Where should the next budget be invested? Which pricing strategy improves profit – not just conversion? Which channel is building sustainable growth?
👉 Marketplace Universe Insight: The greatest value of independent analytics lies not in having more data, but in making visible the connections that remain structurally hidden in fragmented reporting.
Who Benefits – and Who Doesn’t
This should be said explicitly: not every seller needs independent multichannel analytics. Single-channel sellers will gain little from it. The value scales with complexity – with the number of channels, countries, SKUs and teams. The moment different people are making different decisions about the same business using different dashboards, the structural problem that independent analytics solves becomes unavoidable.
Comprehensive business analytics will always remain partly an internal task, even with the best external tools – cost structures and purchase prices are data that many companies prefer not to share with an external platform. Specialised tools can nonetheless deliver aggregated insights for the broader picture and significantly reduce the internal development effort required.
Key Learnings
- The approach is not right for everyone. The value scales with the number of channels, countries and operational complexity.
- Platform-native data is precise – but limited. What happens outside the channel remains structurally invisible.
- ROAS, conversion rate and Buy Box share measure platform efficiency, not business success. The distinction is systematically underestimated.
- Once multiple channels are in play, platform data is no longer directly comparable. Each platform speaks its own language.
- The most profitable channel is rarely the one with the highest volume. Return rates and operational costs shift the picture significantly.
- Independent multichannel analytics shifts decision-making from channel optimisation to business optimisation.